


✨ 作品亮点解析
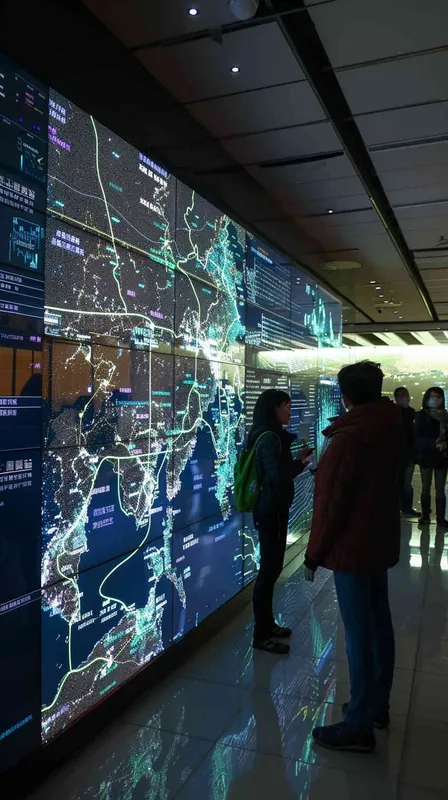
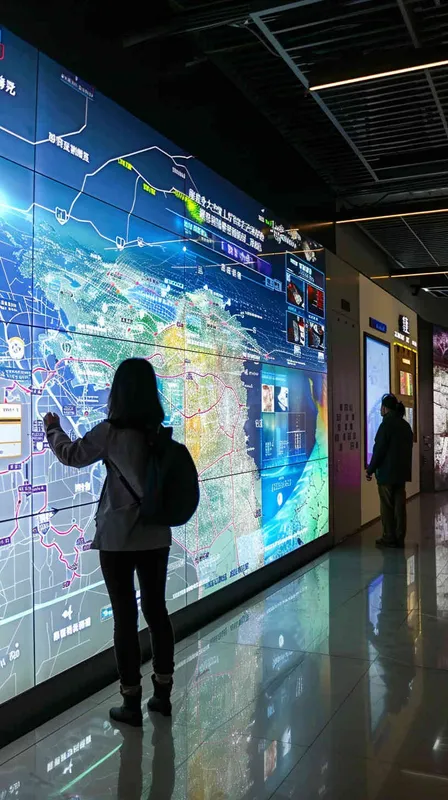
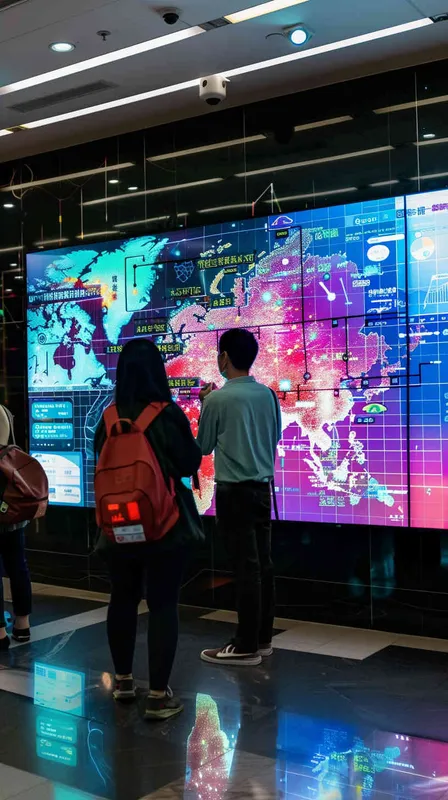
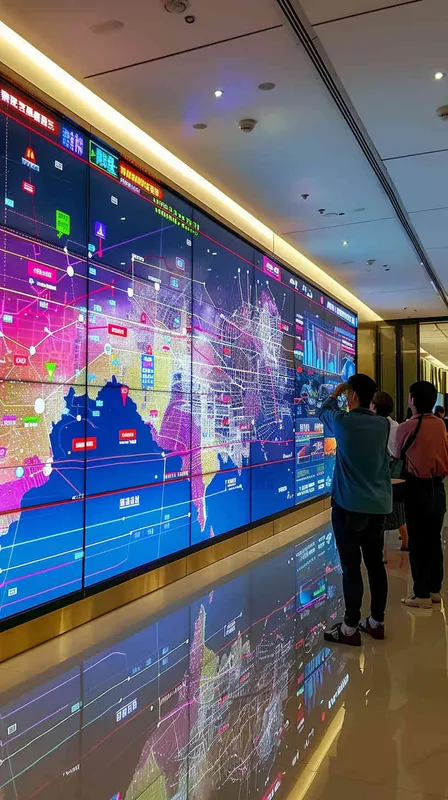
Midjourney是一款先进的绘图软件,专注于通过人工智能生成高质量的视觉内容。它利用深度学习技术,能够将用户提供的文本提示转化为生动的图像,广泛应用于艺术创作、设计、广告等领域。 在一个现代化的信息中心,设计师们围绕着一面巨大的显示屏,紧密地合作着。这个显示屏不仅展示着青岛的城市地图,还实时呈现着丰富的数据,如交通流量、空气质量、天气和人口密度,构成了一幅动态的城市全景。 在青岛的信息可视化设计中,设计师们融合了创意与技术,巧妙地将复杂的数据转化为直观的图形。他们运用鲜明的色彩、流线型的形状和生动的动态效果,让数据呈现出一种既易于理解又引人注目的
🎨 创作提示词
中文提示词
在一个现代化的信息中心中,设计师们围绕着一面巨大的显示屏工作。显示屏上展示出青岛城市地图和各种实时数据,如交通流量、空气质量、天气、人口密度等。 青岛信息可视化设计中,设计师们运用创意和技术,将复杂的数据以图形化的方式呈现出来。他们使用鲜艳的颜色、流线型的形状和动态的效果,使数据变得易于理解和吸引人。 设计师们设计了交互式的界面,让用户能够通过手势或触摸屏幕来探索和操作可视化图形。用户可以自由地缩放、旋转和移动图形,以便更好地理解青岛城市的各种数据。 在青岛信息可视化设计中,设计师们注重数据的层次性和关联性。他们使用图表、图标和地图等元素,将不同的数据进行分类和组织,以便用户更好地发现模式和趋势。 设计师们还注重可视化图形的美学和艺术价值。他们使用精心选择的字体、配色方案和视觉效果,使可视化图形具有吸引力和艺术性。 青岛信息可视化设计的目标是帮助用户更好地理解和利用城市数据。通过直观而美观的图形展示,用户能够快速获取有关青岛城市的重要信息,并做出相应的决策和行动。
英文提示词
In a modern information center, designers work around a massive display screen. The screen showcases a Qingdao city map and various real-time data, such as traffic flow, air quality, weather, and population density. In the field of Qingdao information visualization design, designers utilize creativity and technology to present complex data in a graphical format. They employ vibrant colors, streamlined shapes, and dynamic effects to make the data more understandable and appealing. Interactive interfaces are designed to allow users to explore and manipulate the visual graphics through gestures or touchscreen interactions. Users can freely zoom in, rotate, and move the graphics for a better understanding of the various data related to Qingdao city. In Qingdao information visualization design, designers pay attention to the hierarchy and correlations of the data. They employ elements such as charts, icons, and maps to classify and organize different data, facilitating users’ discovery of patterns and trends. Aesthetics and artistic value play a significant role in visual graph design. Designers utilize carefully selected fonts, color schemes, and visual effects to make the visual graphics attractive and artistic. The objective of Qingdao information visualization design is to aid users in better understanding and utilizing city data. Through intuitive and visually appealing displays, users can swiftly obtain crucial information about Qingdao city and make informed decisions and actions. –ar 9:16 –v 6.0
📝 完整提示词参数
In a modern information center, designers work around a massive display screen. The screen showcases a Qingdao city map and various real-time data, such as traffic flow, air quality, weather, and population density. In the field of Qingdao information visualization design, designers utilize creativity and technology to present complex data in a graphical format. They employ vibrant colors, streamlined shapes, and dynamic effects to make the data more understandable and appealing. Interactive interfaces are designed to allow users to explore and manipulate the visual graphics through gestures or touchscreen interactions. Users can freely zoom in, rotate, and move the graphics for a better understanding of the various data related to Qingdao city. In Qingdao information visualization design, designers pay attention to the hierarchy and correlations of the data. They employ elements such as charts, icons, and maps to classify and organize different data, facilitating users’ discovery of patterns and trends. Aesthetics and artistic value play a significant role in visual graph design. Designers utilize carefully selected fonts, color schemes, and visual effects to make the visual graphics attractive and artistic. The objective of Qingdao information visualization design is to aid users in better understanding and utilizing city data. Through intuitive and visually appealing displays, users can swiftly obtain crucial information about Qingdao city and make informed decisions and actions. –ar 9:16 –q 1 –s 100 –v 6.0
🚀 如何创作类似作品?
想要创作出类似的 AI 艺术作品?只需要简单几步
- 访问 Midjourney 中文版
- 注册账号获得免费生成次数
- 复制上方提供的提示词
- 根据需要调整参数
- 一键生成你的专属 AI 艺术作品
现在注册即可获得 20 张免费生成次数,快来创作属于你的 AI 艺术作品吧!